Digital teams are used to testing: swap a headline, run a split test, declare a winner. Print feels different. It’s physical, it touches fulfillment, and it can be painful to iterate.
But package inserts are also one of the highest-attention channels in eCommerce. If you treat them like a real growth surface (not a one-off design project), they can become a reliable lever for:
- Repeat purchase and AOV
- Referrals and loyalty adoption
- Review collection
- Education (and fewer avoidable tickets/returns)
This playbook shows how to run A/B tests on inserts without creating operational chaos, and how to measure results using:
- QR code scans
- Discount code redemptions
- Conversion activities tracked as "goals" in Klaviyo
For a deeper dive into attribution models and QR strategies, see The Ultimate Guide to Package Insert Attribution.
Step 1: Pick a goal and metric
Choose a single job-to-be-done for the insert. Good examples:
- "Get first-time buyers to complete onboarding"
- "Get subscribers to add a complementary product"
- "Get recipients to convert after a gift"
- "Deflect setup tickets by sending customers to the right guide"
Then pick one primary metric that represents success:
- Revenue metric: attributed revenue per 1,000 orders
- Behavior metric: add-to-cart rate after scan
- Adoption metric: loyalty sign-up completion rate
- CX metric: ticket rate per 1,000 orders (if your insert is educational)
Keep secondary metrics, but don’t let them decide the winner.
Step 2: Write a testable hypothesis
Bad hypothesis: "A better design will perform better."
Testable hypothesis: "For first-time buyers, a QR-led onboarding insert will increase tutorial completion rate compared to a text-heavy insert."
Make your hypothesis specific about:
- Audience (who sees it)
- Change (what differs)
- Outcome (what moves)
- Time window (when you measure)
Step 3: Keep ops simple
If your variants require different paper stock, different pack steps, or different insertion rules, ops will push back (and errors will creep in).
High-signal, low-friction variables:
- Headline + CTA copy
- Offer vs no offer
- QR destination (educational page vs product page vs quiz)
- Layout emphasis (QR-first vs benefit-first)
- Personalized vs generic recommendation block
Avoid testing multiple changes at once. If variant B wins, you want to know why.
Step 4: Tag experiments in Yuzu
One of the biggest reasons print testing fails is that results can’t be compared cleanly later. People end up with a folder of PDFs named "insert-final-v7.pdf" and no way to tie performance back to a variant.
In Yuzu, you can tag experiments and variants directly in your insert setup so results stay attributable:
- Name the experiment (e.g.
onboarding_q2_2026) - Name each variant (e.g.
A_quickstart,B_video) - Associate those tags with the templates (and/or the QR links) used in production
Then when orders ship, the performance data can be grouped by experiment + variant, which makes comparisons straightforward.
How teams compare experiment performance in practice
The cleanest workflow is:
- Use Yuzu to assign each order into an experiment + variant (this is your ground truth).
- Track the immediate offline-to-online engagement (QR scans) from that same tagged setup.
- Measure downstream outcomes (discount redemption, purchase, goal completion) in the system that owns those events (often Shopify + Klaviyo).
Because the experiment + variant labeling is consistent, you can compare:
- QR scans per variant (leading signal)
- Discount redemptions per variant (strong attribution)
- Goal completions in Klaviyo per variant (flexible conversions beyond purchases)
Step 5: Choose your metrics
There are three measurement patterns that work especially well for inserts. You can use one, but the best tests often use two in parallel (a leading indicator + a conversion indicator).
Option A: QR code scans (fast feedback, great directional signal)
If each variant has its own QR destination (or its own tracked QR link), you can compare:
- Scan rate (scans / orders delivered)
- Downstream behavior (landing page conversion, add-to-cart, sign-up)
Scan rate is a strong early signal because it’s immediate. If one variant gets 2x scans, it’s usually telling you something real about clarity, value, and CTA strength.
To keep scans meaningful:
- Put the QR in the same location on both variants.
- Keep the CTA text near the code consistent in size/contrast.
- Make sure destinations load fast on mobile.
Option B: Discount code redemption (clean attribution, slower)
Discounts can work, but only if you treat them as an attribution tool as well as an incentive.
Two reliable approaches:
- Variant-specific generic codes (e.g.
WELCOME10AvsWELCOME10B) - Unique codes per order (more complex, best when you want per-customer traceability)
The advantage: redemption is unambiguous.
The drawback: discounts can change purchase behavior (which may be fine, but you need to interpret results as "incentivized conversion").
Option C: Conversion activities tracked as "goals" in Klaviyo (most flexible)
If your insert drives customers to complete a specific action (not always a purchase), measuring via Klaviyo goals can be ideal.
Examples of insert-driven goals:
- Complete onboarding / tutorial
- Submit a review
- Join loyalty
- Start a subscription
- Request a replacement part
The key is to pass enough context from the physical insert into your digital tracking so you can attribute the goal back to the experiment variant.
Common approaches:
- UTM parameters on the QR destination URL (capture source/campaign/variant)
- Variant-specific landing pages (each page implies the variant)
- Tracked redirect links (where the tracking layer stores experiment metadata)
From there you can:
- Build a Klaviyo segment like "Completed onboarding goal within 14 days of delivery"
- Compare counts and rates between variant A and B
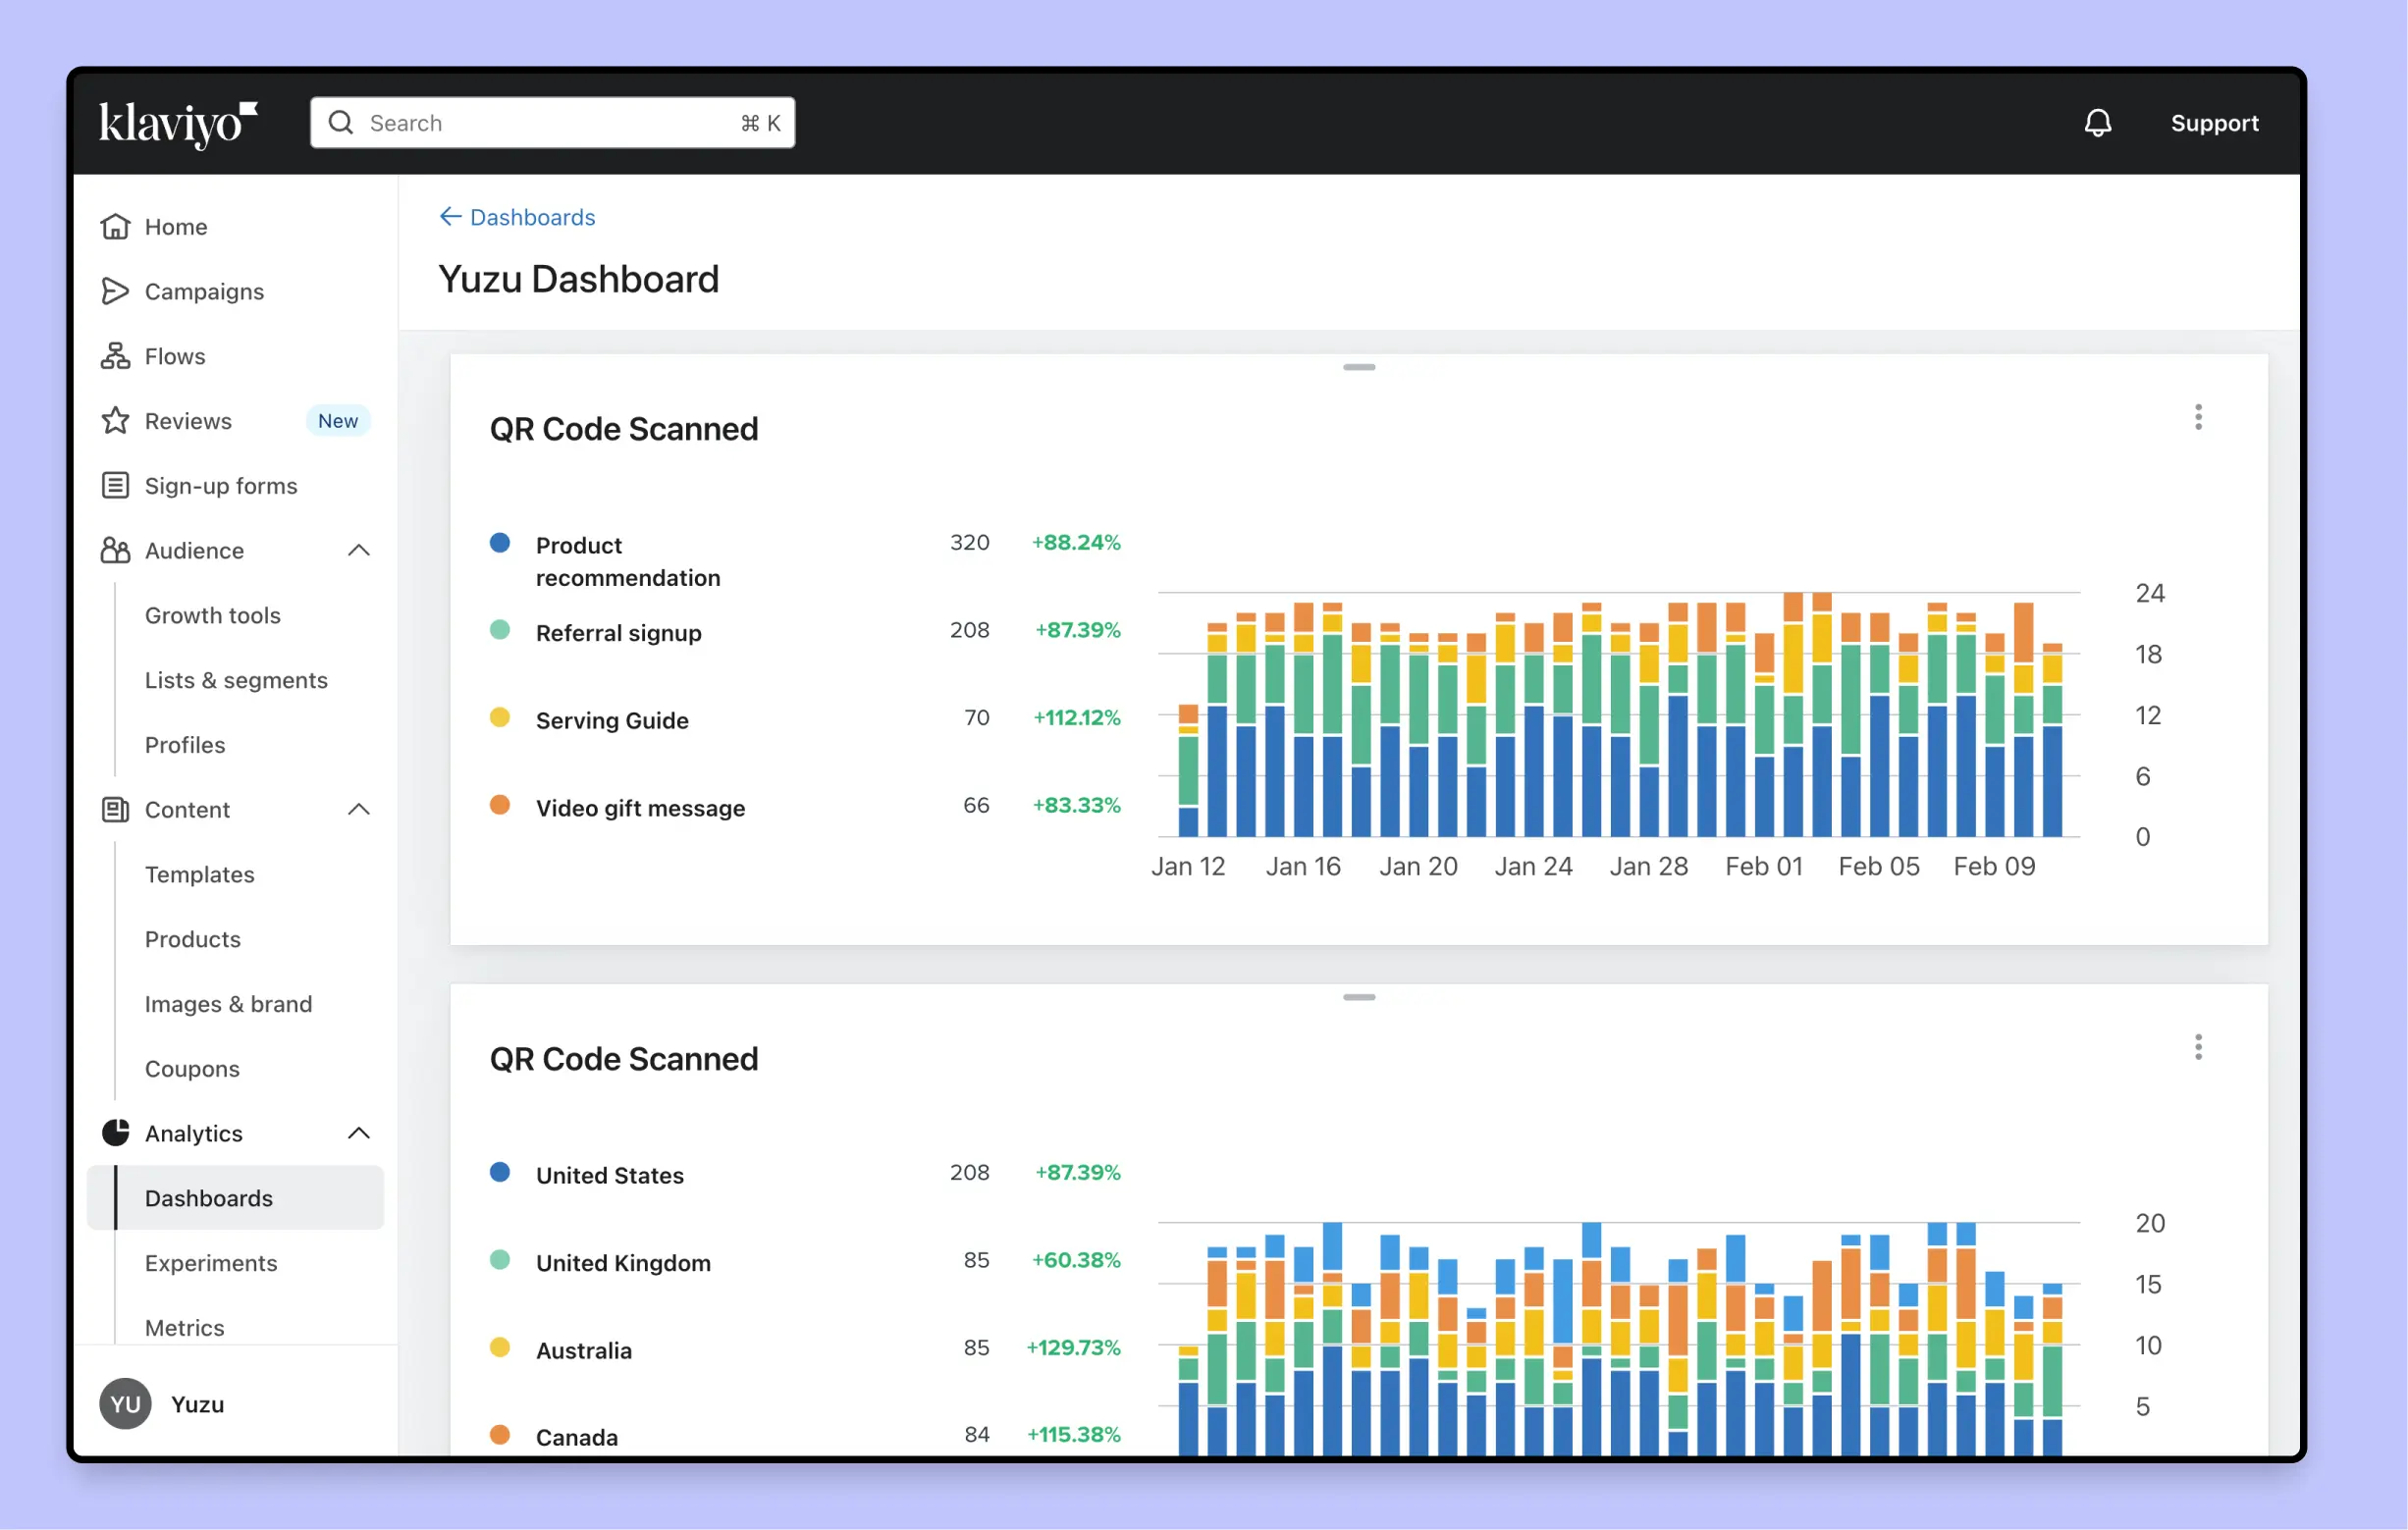
- Use Klaviyo dashboards (or exported data) to visualize performance over time
If you want this to be robust (and not depend purely on UTMs), make sure the event you use for reporting includes explicit experiment metadata. For example:
{
  "event": "package_insert_scanned",
  "properties": {
    "experiment": "onboarding_q2_2026",
    "variant": "A_quickstart",
    "template_name": "Onboarding Insert - Quick Start",
    "qr_id": "onboarding_q2_2026_A",
    "destination": "/onboarding/start",
    "utm_source": "package_insert",
    "utm_campaign": "onboarding_q2_2026",
    "utm_content": "A_quickstart"
  }
}
Step 6: Set your attribution window
Pick a fixed window before you look at results. Examples:
- Scans: 7 days after delivery
- Discount redemption: 14-30 days after delivery
- Repeat purchase: 30-60 days after delivery (category-dependent)
If you change the window after seeing early results, you’re usually just selecting the answer you want.
Step 7: Run with guardrails
These guardrails prevent "print tests" from becoming "warehouse incidents":
- Start with a pilot segment (e.g. first-time buyers in one region).
- Cap the number of live variants (A/B is plenty; avoid A/B/C unless you have huge volume).
- Avoid peak weeks unless the test is specifically for peak.
- Have a rollback plan (one click: route all orders back to control).
If your inserts print at pack-out, this is much easier than traditional bulk print runs because you can iterate without throwing away inventory.
Step 8: Interpret results
You don’t need a PhD to make good decisions, but you do need to avoid common traps:
- Trap: declaring a winner from 30 scans. Early scan-rate differences are useful, but wait for enough volume.
- Trap: optimizing only for scan rate. High scans + low conversion can mean the offer is unclear, the page is slow, or the promise isn’t met.
- Trap: mixing audiences. A variant that works for first-time buyers might underperform for VIPs.
- Trap: changing multiple things. If you changed the offer, layout, and destination, you don’t know what won.
A practical interpretation framework:
- Use QR scan rate as a leading indicator.
- Use redemptions or goal completions as your conversion indicator.
- Use revenue as your tie-breaker (if revenue is the business objective).
A simple experiment template you can reuse
Copy/paste this into your internal doc:
- Experiment name:
- Audience + eligibility rule:
- Primary metric:
- Secondary metrics:
- Variants (what changes):
- Attribution window:
- Stop condition (min orders/time):
- Rollback plan:
- Where results will be reviewed: (Yuzu analytics / Klaviyo dashboard / spreadsheet)
Conclusion
Insert testing works when measurement is designed upfront and ops complexity stays low.
If you want a workflow where experiments are tagged at the source and results are easy to compare across QR scans, discount redemptions, and Klaviyo goal completions, schedule a demo and we’ll walk you through how teams run repeatable insert experiments in Yuzu.