Introduction
Package inserts have a lot of advantages over digital marketing channels. You aren't fighting spam traps, social media algorithm changes, or the distraction of everything else going on in your customers' lives. Marketing inserts cut through the noise, guarantee 100% open rates, and connect you to customers when they're most receptive.
But one of the advantages of digital channels is that they're easy to setup and test. There is a massive ecosystem of tools allowing you to build sophisticated experiments and be confident of the results with just a few clicks. By contrast, package inserts often require collaboration with designers, high-volume print runs, and cooperation from fulfillment teams reluctant to add extra steps to their pick-and-pack workflow.
Yuzu helps to streamline this by printing personalized inserts automatically while an order is picked and packed. This allows marketers to be more precise with their messaging, and experiment with different campaigns much more easily.
Whether you're using Yuzu or traditional inserts, this guide will help you determine if your package insert campaigns are truly working. We’ll cover different attribution techniques, share practical tips, and recommend tools that simplify the entire process.
Building solid foundations
Before you can accurately measure whether your package inserts are driving results, you need to establish a robust data infrastructure. Clever attribution models are useless if your data is scattered across multiple platforms in different structures, and never reconciles into a single source of truth.
By consolidating every data point into a single source of truth you can capture the complete customer journey- from online interactions with ads and emails, to a customer receiving their order and engaging with an insert. This doesn't have to be complicated. Even small or mid-sized brands can achieve a consolidated view by using a single analytics tool or a CDP that integrates their eCommerce, email marketing, and offline events
Apps like Klaviyo provides most of the analytics data you need out of the box. Triple Whale is also a popular single source of truth, with powerful AI features that can help answer your questions in seconds.
Unifying offline & online data
Your email marketing tool probably emits an event to your analytics service when an email is opened by a customer. They use a tiny image embedded in the email called a pixel, and can track when it's been loaded by the recipients' email client. This is how they can show email open rates, customer location and device information.
As we're working with an offline channel we don't have the same visibility and need to use a proxy. Fortunately, package inserts have ~100% open rates, so it's reasonable to assume that your insert has been seen shortly after the order is delivered.
For over 99% of Yuzu prints, the objective is to get a customer to complete a follow up action online. For example it could be to purchase a complimentary product, join a loyalty program, or watch a video gift message.
When your analytics platform knows both the delivery date and when those follow-up goals occur, you’ve effectively placed the edges and corners of your puzzle. It gives you a framework to see what’s working, but there’s still a gap in the middle.
That gap represents the journey between the moment a customer receives the insert and the point they take action online. The more detail you can capture there, the clearer your picture becomes. For example, if you’re promoting a new product on your insert and see that customers purchase it within five days of delivery, you can reasonably credit the insert for driving that sale. On the other hand, if the insert contains a QR code that leads customers directly to a pre-filled basket, any subsequent purchase is clearly attributable to the insert.
Attribution models
Before diving into specific frameworks, let’s revisit the scenario from earlier: a customer receives an insert promoting a new product, scans a QR code, and adds the item to their cart. But this time they get sidetracked and later complete the purchase after seeing an abandoned cart email. Do you credit the email, the insert, or both? This is where attribution models shine, helping you untangle the interplay between offline and online channels so you can accurately measure the true impact of each touchpoint.
First-click attribution
- Definition: The first interaction in the customer’s path to conversion gets all the credit.
- Pros: Valuable for understanding which channels spark initial awareness or engagement.
- Cons: Discounts the role of later interactions that lead a customer to conversion.
Since package inserts generally appear post-purchase, it’s less common to need first-click attribution. However, there are two scenarios where it might still be useful. For referral campaigns, a customer may share an insert containing a unique referral code with a friend, making that printed code the very first interaction the referred friend has with your brand. Another scenario is insert swaps, where your brand advertises another company’s product. If the insert is the customer’s initial exposure to a partner brand, first-click attribution can capture that moment of discovery.
Last-click attribution
- Definition: The final interaction before a conversion receives 100% of the credit.
- Pros: Straightforward to implement and easy to report on.
- Cons: Oversimplifies the journey by ignoring earlier interactions that may have “warmed up” the customer.
When it comes to package inserts, last-click attribution can be suitable if you're using a printed coupon code that can be redeemed at checkout. This model is easy to set up but may fail to capture the influence of channels that led the customer to even consider your brand or product in the first place. Still, for brands testing package inserts for the first time, last-click offers a quick way to see direct conversions.
Multi-touch (or custom) models
- Definition: Rather than awarding all credit to a single interaction, multi-touch models distribute partial credit across each key interaction in the customer journey.
- Pros: Offers a comprehensive view of how different channels (online and offline) work together, showing where inserts fit into the bigger picture of your marketing funnel.
- Cons: More complex to implement and requires deeper data collection, technology integrations, and analytical expertise.
Multi-touch modeling is especially useful for clarifying how your package inserts work alongside social ads, email marketing, and loyalty initiatives to nudge customers toward a purchase. By assigning fractional credit, you see the interactions that matter most at each stage of the funnel.
Setting up a multi-touch model for inserts typically involves:
- Advanced tracking: You’ll need unique codes or dynamic QR links on the insert that can feed data back into your analytics platform.
- Holistic data integration: Combine data from online events (e.g., ad clicks, email opens) with offline milestones (e.g., package delivery dates) in a central dashboard or data warehouse.
- Attribution logic: Decide how to weight each interaction using a linear, time-decay, or custom curve approach. Then ensure offline events like scans or code uses align with those rules.
- Control groups & cohort analysis For a deeper look at true incremental impact, you can compare the behavior of customers who received the insert to those who didn’t.
By capturing both online and offline data, multi-touch attribution helps you see which touchpoints drive engagement and purchases. If you want to prove exactly how much extra revenue or retention the insert truly drives, you’ll need to combine multi-touch insights with a holdout group. We’ll explore that in more detail later, in Incrementality & indirect effects.
Attribution windows
While digital attribution windows can be relatively short, package inserts have a longer shelf life. In fact, Yuzu data shows some customers hold onto inserts for six months before finally scanning and buying. As a best practice, do a cohort analysis of insert recipients to see how long it takes for 99% of scans to occur, then set your attribution window accordingly (often between 30 and 90 days).
Interestingly, our data suggests that average order value somewhat correlates with engagement time: higher AOV brands may observe a longer lag between insert delivery and eventual scan or conversion activity, while brands with lower AOVs (<$50) often see quicker conversions.
Once you decide on an attribution window, continue to monitor engagement beyond it and re-evaluate periodically, especially around seasonal promotions.
QR codes
QR codes are a great way to bridge your offline and online customer experiences, and reduce the friction between them. They're also one of the most helpful tools available to marketers to measure engagement with package insert campaigns. We've seen adoption increase considerably over the last 5 years, but it’s still worth testing whether your particular audience is comfortable with scanning codes or prefers other methods such as short vanity URLs.
Generic QR codes
A generic QR code points to the same destination for anyone who scans it. This straightforward approach is often used for large, pre-printed insert runs where you haven’t tied each code to a specific order or customer.
- Setup: Embed UTM parameters like
utm_source=package_insertor use a tracking redirect link, so your analytics platform can identify sessions and conversions that come from these scans. - Potential insights: You’ll see how many total scans occurred and how many resulted in conversions, but won’t necessarily know which customers scanned or which segments engaged more than others.
- Customer recognition: If a shopper checks out, completes a form, or otherwise identifies themselves after scanning, your analytics tools can retroactively link that scan to a customer profile, but this is typically a small percentage of overall scans. If the scanner was recently identified on the same device and you use analytics cookies, your analytics tool should also be able to associate the scan with their profile.
{
  "event": "qr_code_scanned",
  "qr_id": "generic_spring_2026",
  "destination": "/landing-page",
  "context": "generic_insert",
  "utm_source": "package_insert",
  "utm_campaign": "spring_2026"
}
Personalized (unique) QR codes
Personalized QR codes are unique to each package insert. This allows you to encode extra information about each customer or order, opening the door for detailed analysis and more tailored online customer experiences. Yuzu automatically generates personalized QR codes for each insert that redirect via a tracking link, allowing for:
- Precise attribution: When scanned, you can fire an event (e.g., “insert_scanned”) tied directly to the customer, order, and package insert received. This allows you to understand how scan rates compare between segments and cohorts using customer properties in your analytics database, and understand the content that drives most engagement on your inserts.
- Flexible destinations: If you have time-bound offers or seasonal campaigns, you can change the destination routing after the insert is printed. For example, if you're running a Black Friday promotion and the recipient scans in December, you could direct them to a different page and trigger an email flow tempting them with a different offer.
- Consolidating fulfillment codes and avoiding data clutter: Yuzu allows you to consolidate marketing and fulfillment actions into a single QR code. For example, a member of the fulfillment team can scan to bring up order picking details, but when the end customer scans it takes them to a landing page or pre-filled basket. You can also set up filters to only emit scan events to your CDP, when the QR code is scanned by the customer so it doesn’t pollute your marketing analytics.
{
  "event": "qr_code_scanned",
  "qr_id": "wine_pairing_456",
  "destination": "/landing-page",
  "customer_id": "cust_001",
  "customer_email": "[email protected]",
  "template_id": "123456789",
  "template_name": "Tasting notes with video recipe",
  "context": "video_recipe",
  "experiment_id": "987654321",
  "order_id": "order_789"
}
These examples highlight how Yuzu customers leverage personalized QR codes to streamline offline-to-online experiences and boost engagement with package insert campaigns:
- Product recommendations with pre-filled baskets - With Yuzu's Rebuy app, inserts can include dynamic product recommendations and QR codes that pre-fill the cart with the recommended products, simplifying checkout to just a few taps.
- Wine brand tasting notes - One of Yuzu’s customers prints detailed tasting notes alongside a QR code that leads to a recipe video, perfectly paired with the wine purchased. This approach has driven amazing results in engagement and repeat orders.
- Encouraging product reviews - A QR code can launch a product review form that already knows which item the customer purchased. By auto-filling product details, you increase the likelihood of timely, relevant reviews.
- Live customer support - Some brands embed a code that opens a chat with the support team, automatically including the customer’s order or account details so they don’t have to re-enter them. This is ideal for complex products requiring onboarding or setup assistance.
- Returns portal - Direct customers to a returns page pre-filled with their order details, making the process faster and more convenient.
- Personalized setup or tutorial videos - A brand selling electronics or household appliances link customers to a product-specific how-to video, reducing support tickets and encouraging positive reviews.
Coupon codes
Whereas QR codes focus on seamless scanning experiences, coupon codes add the incentive of a special offer or reward. As well as driving sales, these codes also function as a powerful attribution tool, letting you track which inserts lead to additional revenue or referrals.
Generic coupon codes
Generic coupon codes (e.g., SPRING2026, THANKYOU10) are straightforward, applying the same promotion to every customer who redeems them. They’re common in large, pre-printed insert runs where personalizing each code isn’t feasible.
Setup
Create a coupon code in your eCommerce platform or marketing app, then include if on your insert design. You can encode the coupon code in a QR code or embed it through a shortened vanity url, so it can apply automatically when the user checks out.
We suggest using dedicated coupon codes for package insert campaigns, so you can confidently attribute conversions. If you do share promotional codes across channels, you can use QR codes or vanity links with tracking parameters, to provide digital breadcrumbs that trace each conversion back to the package insert campaign. Keep in mind that this won't work some more complex customer journeys. A shopper might receive your insert, later search for your brand online, and use the coupon at checkout, without ever scanning a QR code or visiting a tracking link. This is why we recommend using dedicated generic coupon codes, or for even more precise attribution, using personalized, unique coupon codes.
Attribution & insights
When customers redeem the code at checkout, your sales channel and analytics tools will emit events containing the customer details and purchase details. You’ll see the total redemptions and resulting revenue, and can calculate an overall redemption rate from the package insert campaign.
Limitations
Generic codes might leak onto coupon websites, which hurts your P&L and skews your attribution. It's also difficult to prevent customers from returning and repurchasing the products they just received, at a discount.
{
  "event": "coupon_code_redeemed",
  "timestamp": "2025-01-01T12:34:56Z",
  "discount_code": "SPRING2026",
  "discount_type": "percentage",
  "discount_value": "10.00",
  "customer_id": "cust_123",
  "customer_email": "[email protected]",
  "order_id": "order_9876",
  "total_before_discount": "110.00",
  "net_sale": "99.00",
  "currency": "USD",
  "items_purchased": [
    {
      "sku": "SKU-ABC",
      "quantity": 2,
      "unit_price": 25.00
    },
    {
      "sku": "SKU-DEF",
      "quantity": 1,
      "unit_price": 60.00
    }
  ],
  "context": "generic_insert",
  "utm_source": "package_insert",
  "utm_medium": "offline",
  "utm_campaign": "spring_2026"
}
Personalized (unique) coupon codes
For more detailed attribution and control of coupon redemptions, unique (or single-use) coupon codes can be generated for each customer or package insert. As well as helping attribute discounting initiatives, but also enables accurate attribution of referral campaigns, where new purchases can be associated back to the referrer.
Precise attribution & insights
Each code is generated for each package insert dynamically, and is associated to a specific customer or order. This means that you can accurately calculate redemption rates, broken down by any properties you store about each customer. For example, you could compare redemption rates for high value customers that have placed over 3 orders, with customers in a cohort that purchased a specific product in the last 30 days.
Flexible configuration
You can restrict usage to certain products or collections, or exclude items the customer already bought, preventing “return and repurchase” abuse. You can also apply time limits (e.g., 30 days) or usage limits (e.g., single-use), removing the possibility of coupon leakage.
Limitations
As with any discounting campaign, the cost of the discount needs to be considered in ROI calculations, and for some brands operating with tight margins it might not make sense at all. Excessive use of discounting can also lead customers to question the quality and value of a product, desensitize them to your offers, and damage brand reputation.
{
  "event": "coupon_code_redeemed",
  "timestamp": "2025-01-02T09:00:00Z",
  "discount_code": "SARAH-SAVE10-1234",
  "discount_type": "fixed",
  "discount_value": "10.00",
  "customer_id": "cust_009",
  "customer_email": "[email protected]",
  "order_id": "order_431221",
  "total_before_discount": "159.99",
  "net_sale": "149.99",
  "currency": "USD",
  "items_purchased": [
    {
      "sku": "SKU-GHI",
      "quantity": 1,
      "unit_price": 80.00
    },
    {
      "sku": "SKU-JKL",
      "quantity": 2,
      "unit_price": 35.00
    }
  ],
  "applies_to": ["SKU-GHI", "SKU-JKL"],
  "context": "personalized_insert",
  "utm_source": "package_insert",
  "utm_medium": "offline",
  "utm_campaign": "welcome_offer"
}
Cohort analysis
Cohort analysis helps you measure how groups of customers behave over time based on when and how they engaged with your inserts. It's especially valuable for offline channels like package inserts, which may drive long-tail behavior and repeat purchases well after the unboxing.
By tracking cohorts, you can see patterns that aren’t visible in metrics that capture a snapshot in time. For instance, you might discover that 10% of customers who received an insert in January made a repeat purchase by February, while only 7% of those who received it in March did the same. This insight is only possible through cohort analysis, and could indicate a seasonal dip or a design change that negatively affected engagement. There are many ways to define a cohort, and the right one will depend on the questions you're trying to answer in your analysis.
- Time-based cohorts: Assign customers to cohorts based on the month or week they received (or scanned) your insert. This reveals trends like how quickly recipients make a second purchase or redeem a discount after delivery.
- Offer-based cohorts: When running multiple insert campaigns simultaneously (like one offering 10% off and another offering free shipping), cohort analysis can show which campaign results in higher LTV or faster repeat purchases.
- Segment-based cohorts: Group customers by relevant properties, such as “first-time buyers” vs. “VIPs,” and examine how each responds to the same insert message or design. This is straightforward to implement if you’re using personalized QR codes or coupon codes.
As you track cohort performance, pay attention to a handful of core metrics that reveal the long-term impact of your inserts. For instance, the repeat purchase rate will tell you how many recipients return to buy again within a specific timeframe (e.g., 30, 60, or 90 days). Similarly, average order value (AOV) sheds light on whether certain cohorts tend to spend more on subsequent purchases. If you’re promoting add-on products, analyzing upsells or cross-sells within each cohort helps you see how often customers take advantage of those specific offers. And if your inserts encourage sharing a referral code, tracking sign-ups by cohort highlights which designs or messages drive the highest referrals.
Putting these metrics together gives you a clear window into how an insert’s impact evolves over time: if one particular design consistently boosts repeat purchases or referral sign-ups, that’s your cue to double down on that approach, and potentially expanding the initiative to more customers. If a specific customer segment rarely responds to your offers, it's time to experiment with something else.
Cohort analysis shows how customer engagement unfolds over time - revealing not just whether your insert worked, but how its impact evolves over weeks or months. This big-picture view sets the stage for more targeted experimentation, which we'll cover next.
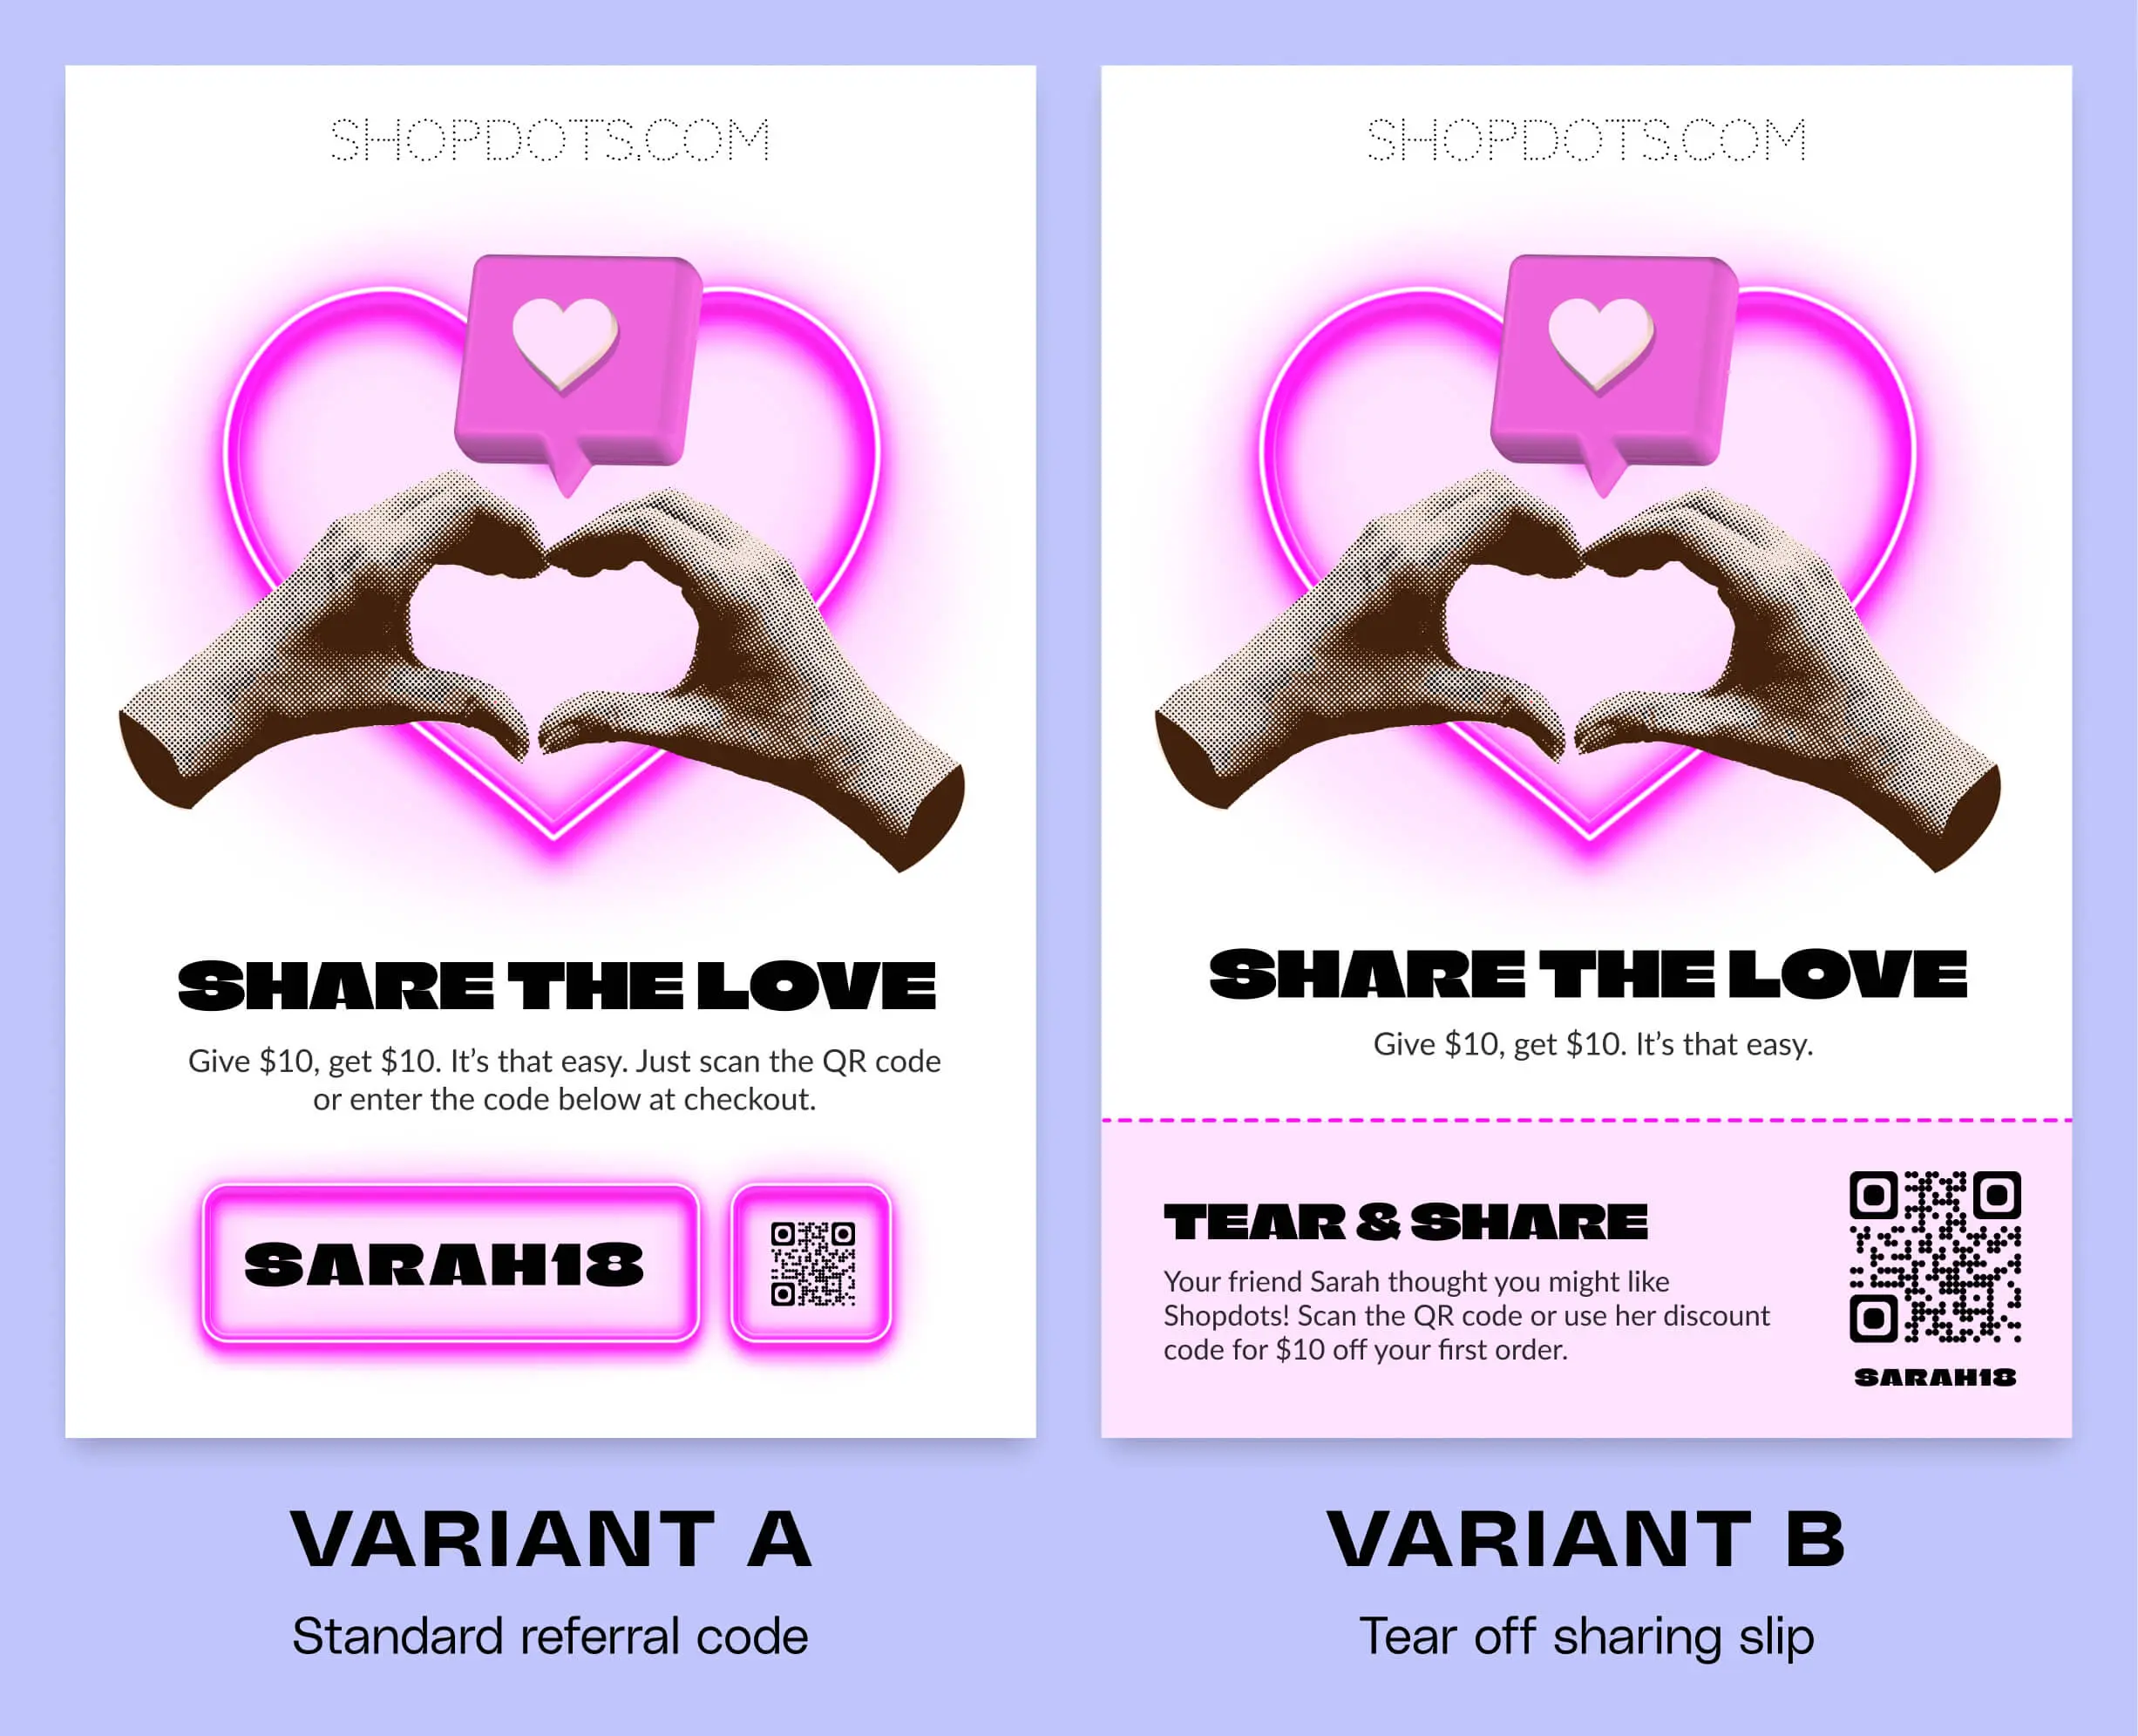
A/B testing
While cohort analysis provides the big-picture view of how insert campaigns perform over time, A/B testing focuses on direct comparisons between different versions of your inserts to see what resonates most with customers.
Generic pre-prints are less practical to test and iterate with than personalized prints, due to the cost and long feedback loop. If you want to conduct A/B tests with generic pre-prints, we recommend focussing your experimentation on a handful of the most important variables. You may also be able to conduct proxy digital tests that provide some signal before investing in a large scale offline experiments. FERMÀT and Replo are great options for building beautiful landing pages, and may allow you to iterate faster than with generic pre-printed inserts.
Overview of the experiment methodology
- Define a hypothesis: For example: “We believe that offering free shipping on our package insert offer (Variation A) will result in more repeat purchases than offering 10% off (Variation B).”
- Determine success metrics: Clarify what outcomes you’re measuring: are you trying to increase overall revenue, boost average order value (AOV), or drive more email sign-ups?
- Create test variations: Keep the design consistent except for one core difference (e.g., discount type, CTA wording, or insert layout).
- Randomly assign variations: Each order gets Variation A or Variation B, ensuring a fair comparison.
- Track & measure: Monitor the key performance indicators (KPIs) that define success from step 2, to evaluate if your hypothesis is correct.
- Analyze the results: Compare how Variation A vs. Variation B performed on your primary metrics, and look for statistically meaningful differences (which we’ll cover in the next section).
When using pre-printed inserts, be careful about your distribution method to ensure a random trail. For example, if different inserts are used at different packing benches, and certain products are only routed to specific benches, you could inadvertently skew your results because of an unknown relationship between products purchased and your success metric. Yuzu solves this by printing the randomly selected variant directly at the packing bench, eliminating both routing bias and picking errors.
Selecting a success metric
A/B testing package insert campaigns often starts with scan rate (if you’re using QR codes), since it’s a quick measure of engagement. But scanning alone doesn’t tell the full story. You’ll want to chain that scan event to a conversion goal like a completed checkout, loyalty program sign-up, or product review submission. Here are some typical KPIs and conversion goals for some typical package insert use cases.
| Objective | Conversion Goal | Primary KPIs |
|---|---|---|
| Drive repeat purchases through personalized recommendations | Purchase of recommended product within 30 days | Attributed repurchases, Repurchase frequency |
| Increase retention through targeted incentives | Redemption of coupon code on next purchase | Attributed net sales, Repurchase frequency |
| Accelerate growth through customer referrals | New customer completes first purchase using referral code | Referral program signups, Revenue generated through referred orders |
| Grow subscription revenue and reduce churn | Upgrade to higher subscription tier or renewal | Churn rate, Subscription upsell rate, Customer lifetime value (LTV) |
| Improve product satisfaction through education | Completion of product guide or tutorial | Net Promoter Score (NPS), Review metrics, Repeat purchase rate |
| Increase customer loyalty through VIP programs | Completion of first loyalty program action | Program uptake rate, Credit/points value of actions performed, Customer lifetime value |
| Gather actionable customer feedback | Survey completion | Number of survey responses |
| Streamline returns process and recover revenue | Successful self-service return initiation | Repurchase rate of returning customers, NPS, Review metrics |
| Increase gifting purchase frequency | Gift recipient makes first purchase | Organic referral rate |
| Increase social proof through customer reviews | Submission of verified product review | Number of reviews collected, Average review score |
| Drive online to offline conversion | In-store visit or purchase | Retail sales uplift, Voucher redemption rate |
Incremental lift
So far, most of our attribution methods focus on direct actions like scanning a QR code or redeeming a discount. But what if you see a general increase in a key metric, such as repeat purchase rate or average order value, and you want to confirm that it's genuinely driven by your inserts?
Using holdout groups
One of the most reliable ways to measure true incremental impact (also called lift analysis) is by running a holdout test.
- Select a baseline: Randomly choose a percentage of orders that do not receive any promotional insert (or a neutral thank-you note without a call-to-action).
- Compare key metrics: Track how both groups perform on broader KPIs such as repeat purchase rate, revenue per customer, and lifetime value over a timeframe of 30, 60, or 90 days.
- Calculate incremental lift: If the group that received inserts consistently outperforms the baseline, you can attribute that improvement to your insert campaign even if you don’t see a directly connected event (like a QR code scan).
Example: If your baseline repeat purchase rate is 8% and the group with inserts hits 9.5%, that’s a 1.5 percentage-point lift. Over thousands of orders, that can be significant.
Indirect effects
While a formal holdout test is the gold standard for proving incrementality, sometimes it’s not practical. For example, operational constraints may prevent you from randomly skipping inserts on certain orders. In these cases, you can still look for indirect signals of success:
Observational data & trend analysis
- Compare cohorts over time: Watch how purchase frequency evolves before and after launching an insert campaign. A sudden or sustained uptick can indicate your inserts are having an impact.
- Look at regional or segment differences: If certain fulfillment centers (or subsets of your customer base) start receiving inserts at different times, compare those groups’ metrics to the original process.
Observational approaches are less rigorous than a holdout test, but they can still hint at whether inserts are driving an overall lift, particularly when improvements continue over multiple cycles
Balancing direct vs. indirect signals
- Direct (e.g., QR code scans): Precise, but these metrics only reflect insert-driven actions customers explicitly trackable, and might not tell the full story.
- Indirect (e.g., baseline revenue lift): Reflect the total effect, including people who might not scan a QR code but still return to purchase because of your insert’s influence.
By combining direct tracking with holdout-based (or observational) analysis, you’ll gain a more holistic view of how inserts influence both immediate conversions and long-term customer behavior. And in the next section, we’ll look at how to determine if those differences are statistically significant.
Statistical significance
In many ways, statistical significance is the final checkpoint that tells you whether your observed results are truly different or simply due to chance. For package inserts, which often have smaller, slower data streams compared to digital ads or emails, it’s especially important to validate your findings.
Key Concepts
- p-Value: The probability that the difference you observed could occur by random chance. A p-value below 0.05 indicates the results are “statistically significant” at the 95% confidence level.
- Confidence interval: A range of values where the “true” result likely falls. Narrow intervals suggest more precise estimates.
- Minimum detectable effect (MDE): The smallest difference you want to be able to confidently measure. If your baseline scan rate is 3%, for instance, you might set an MDE of +1% (4% total) to decide if a new insert design is worthwhile.
Package insert testing requires a different mindset than digital experimentation. With offline touchpoints, customer responses are typically slower and fewer, stretching your data collection over weeks or months rather than days. This timing affects both your sample size requirements and testing approach.
Start by establishing your baseline metrics. If your current package inserts see a 2% redemption rate on coupon codes, use this as your foundation. Next, define your Minimum Detectable Effect (MDE) - the smallest improvement that would make changes worthwhile. For example, if you're aiming to boost redemptions by 30% (from 2% to 2.6%), use these targets in your sample size calculations.
The extended timeline of insert testing brings unique challenges. Inserts might sit on a customer's counter for weeks before triggering action, and longer test periods increase the chance that seasonal factors or external events could influence your results. Consider these variables when analyzing your data.
Statistical significance isn't the only measure of success. Even if your data shows a statistically valid improvement (like a 1% increase in scan rates), evaluate whether this uplift justifies the operational changes or costs involved. A "winning" variation needs to deliver both statistical and practical value.
When running multiple tests simultaneously, you increase the risk of false positives - apparent improvements that actually stem from random chance. To maintain test integrity:
- Limit the number of variants: Focus on your top priority changes, rather than testing everything at once.
- Adjust your confidence threshold: Some brands use a more stringent p-value (e.g., 0.01) if they run many concurrent experiments.
- Sequential or tiered testing: Test big changes first, then refine with smaller tweaks once you’ve identified the clear winners.
With sound statistical methods and accounting for the unique characteristics of offline testing, you'll build a more effective optimization strategy for your package insert program.
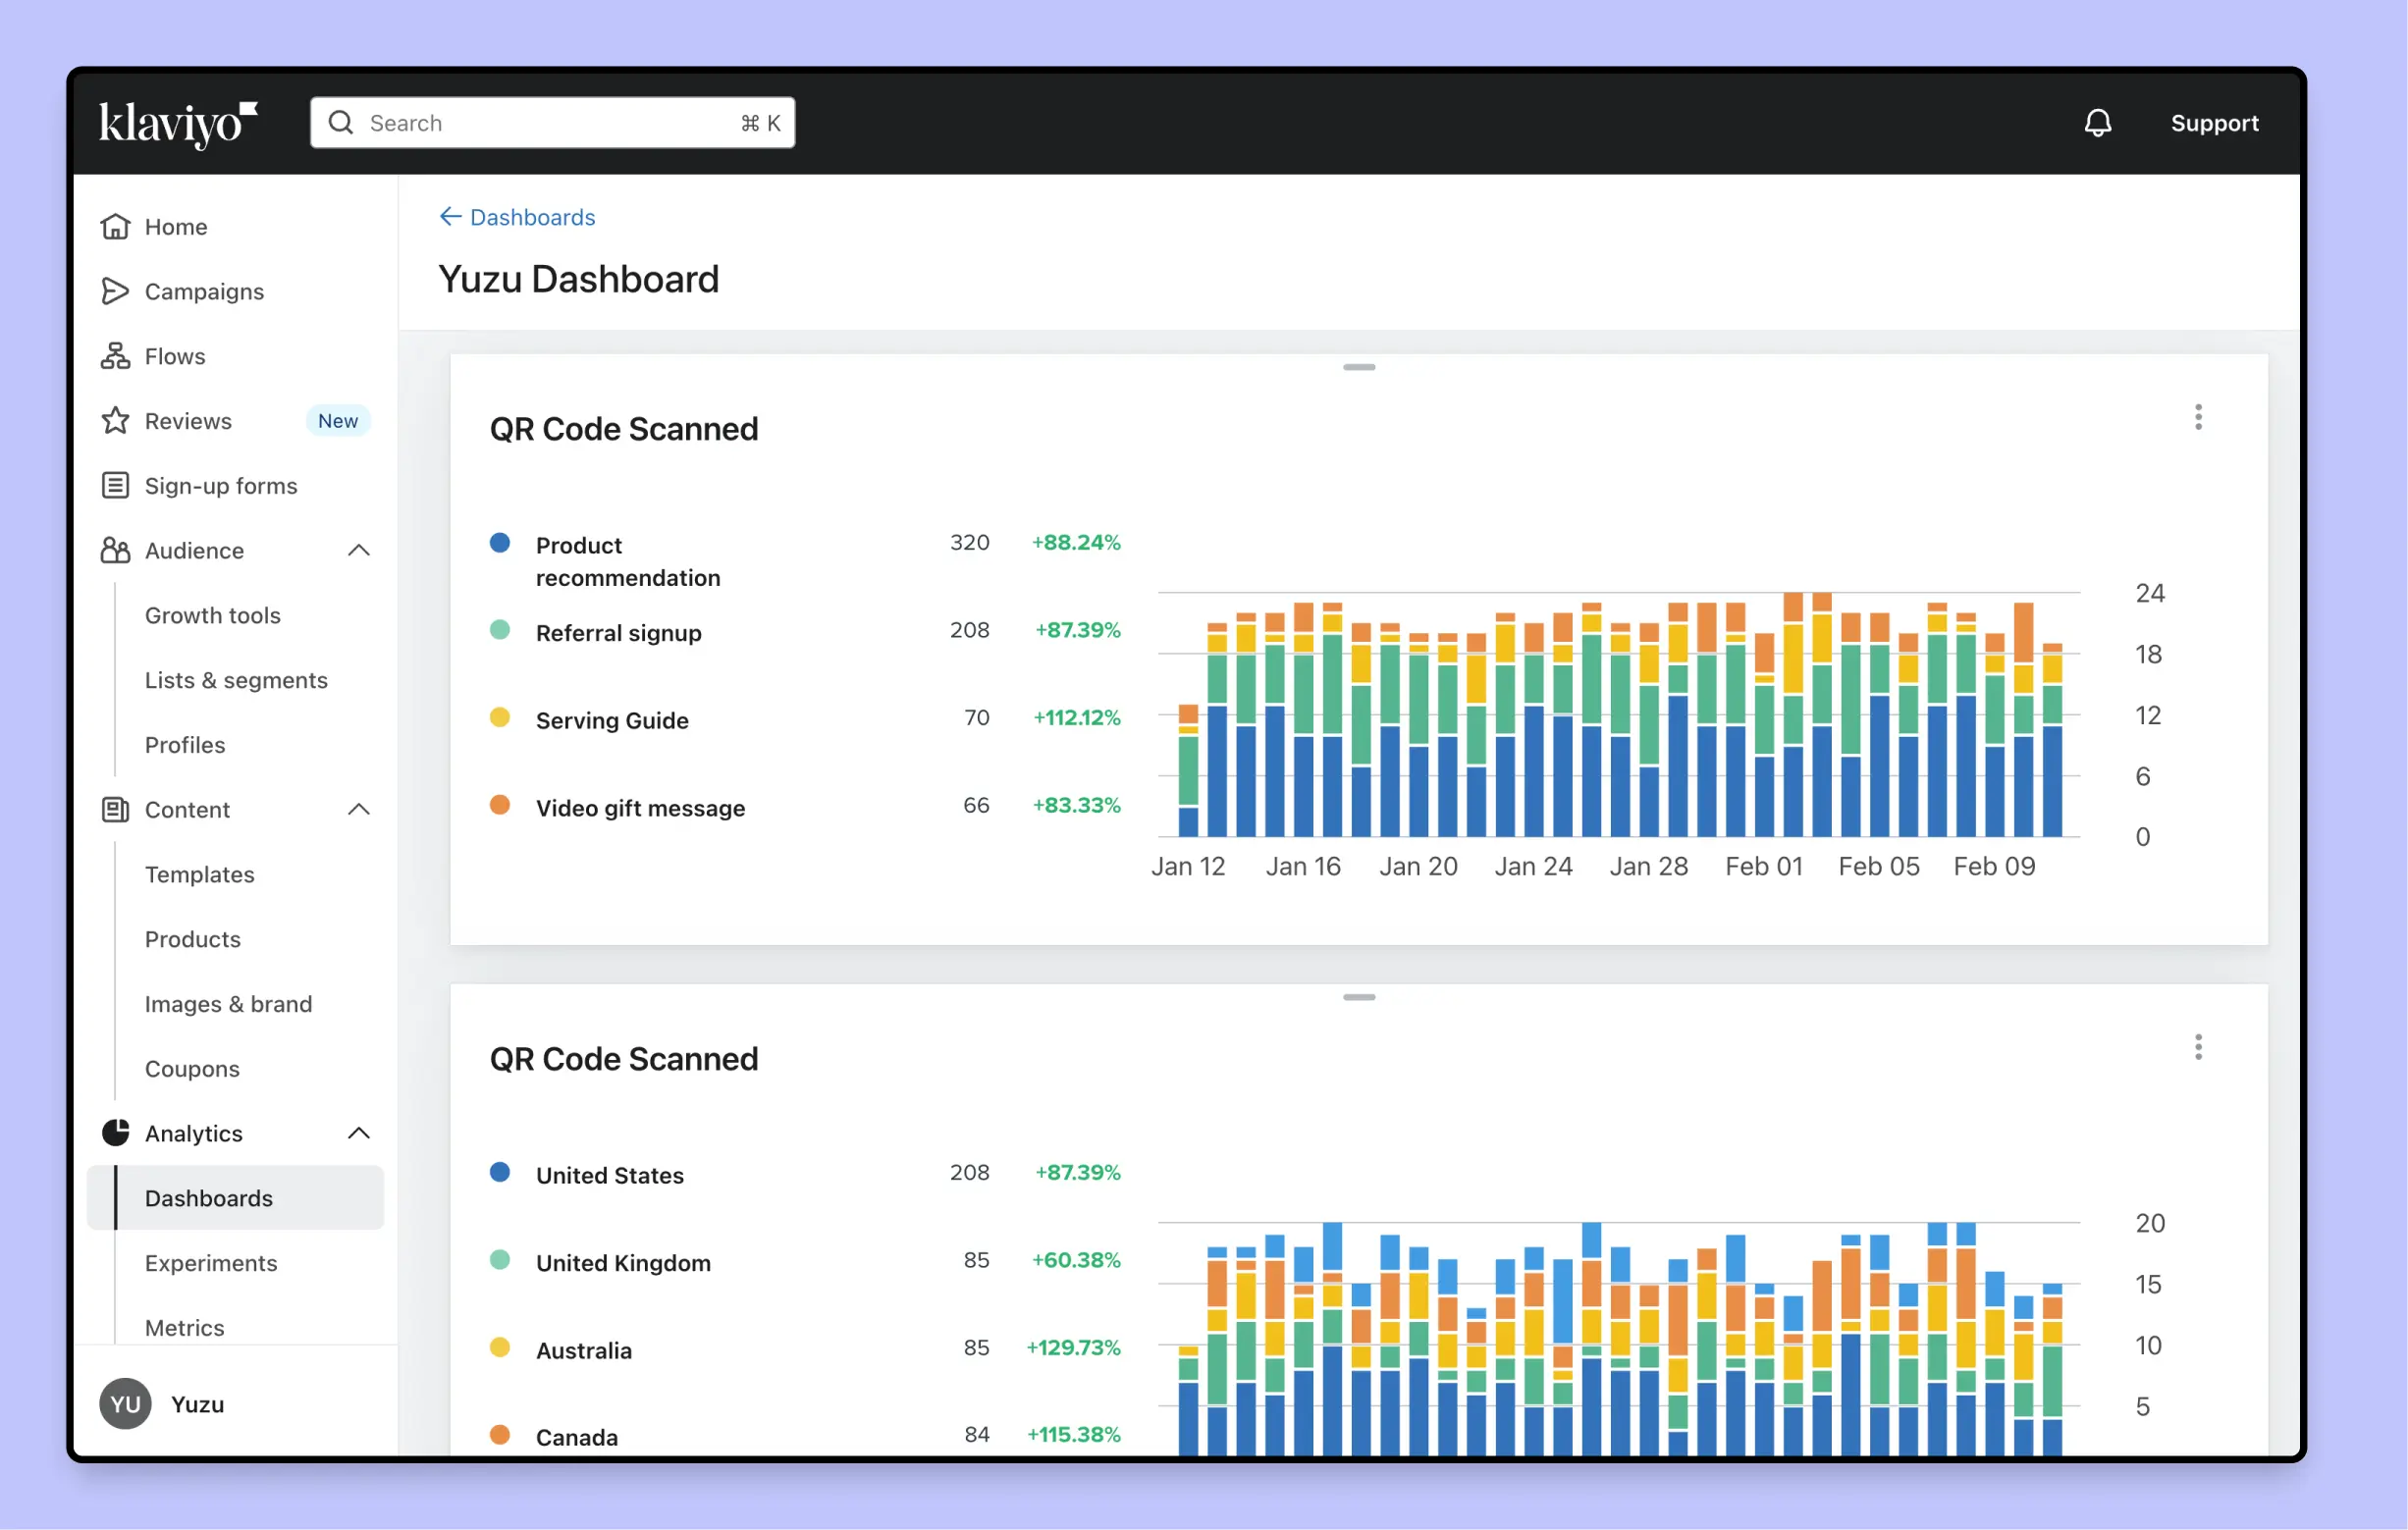
Reporting & dashboards
Even if you've set up robust tracking, it won't mean much unless you can visualize the results in a clear, actionable way. This is where dashboards and reporting become essential. Modern visualization platforms like Looker, Power BI, and Google Data Studio enable you to aggregate data from multiple sources into a unified view, bringing together your eCommerce platform, analytics tools, and package insert events.
Key metrics to track
- Scan & redemption funnels: How many recipients scanned a QR code or redeemed a discount, and how many proceeded to your conversion goal?
- Cohort performance: Monthly or weekly cohorts, repeat purchase rates, LTV, and how they've changed since introducing your insert campaign.
- Incremental lift from holdout groups: Visualize how a control group (no insert) compares to your test group(s) on revenue or engagement metrics.
When it comes to data refresh rates, consider your needs carefully. Real-time dashboards can help you spot sudden anomalies like unexpected spikes in redemptions, while scheduled updates might be sufficient for insert campaigns with longer engagement cycles. Many businesses find that daily or weekly refreshes provide the right balance between staying informed and avoiding unnecessary noise.
To stay proactive, implement automated alerts for significant changes in your key metrics. For instance, set up notifications if your redemption rate falls below a certain threshold, allowing you to quickly investigate and adjust your strategy as needed.
The true power of comprehensive reporting lies in its ability to unite both online and offline touchpoints. By viewing insert performance alongside digital channels like ads, email, and social media, you'll gain a complete picture of your customer journey and make more informed decisions about your marketing mix.
Privacy & compliance
Personalizing package inserts can boost engagement, but it also raises important privacy considerations, especially when encoding user data or collecting new information through QR codes and discount redemptions.
The key is to minimize sensitive data usage, including only what's strictly necessary for your campaign. Transparency is crucial when collecting additional data. If scanning a QR code or redeeming a discount automatically enrolls customers in email marketing, make this clear upfront.
Consider carefully how long you'll retain offline-to-online event logs, such as insert scan events. Major privacy regulations like GDPR and CCPA require both a clear rationale for storing personal data and the ability to remove it upon request.
By taking a thoughtful approach to privacy, you not only stay compliant with regulations but also build trust with customers who appreciate seeing their data handled responsibly.
Conclusion
Package inserts are a powerful channel that can engage customers when they're most receptive, but it's crucial to accurately attribute their impact on your business to make informed decisions. With QR codes, coupon codes, and methods like A/B testing, holdout groups, and cohort analysis, you should now be equipped to analyse package insert campaigns, and build useful experiments to optimize performance.
By centralizing your data, choosing the right attribution model, and verifying results through statistical significance, you’ll understand not just whether inserts work, but how they lift key metrics like repeat purchases, referrals, and AOV. And if you see a broader, indirect uplift that can’t be directly traced to a code scan, you can use holdout testing or observational analysis to prove the campaign’s incremental impact.
As you move forward, remember these key takeaways:
- Establish solid foundations: Integrate offline and online data into a single source of truth.
- Use the tight tools: From personalized QR codes to unique coupon codes, build precise links between inserts and online behavior.
- Experiment strategically: Cohort analysis, A/B tests, and holdout groups will reveal what works and what doesn’t.
- Mind privacy & compliance: Personalization is powerful, but handle customer data ethically and transparently.
- Measure & refine: Dashboards bring your data to life, and a clear plan for analysis will help you iterate toward ever-better results.
In short, package inserts no longer have to be a “black box” in your marketing mix. With the right setup, you can measure and optimize them just like any digital channel, bringing a new dimension of creativity and engagement to your marketing strategy. If you're still using generic pre-printed inserts and want to learn more about what makes personalized inserts more powerful, we'd love to talk! Book a demo with the team here.